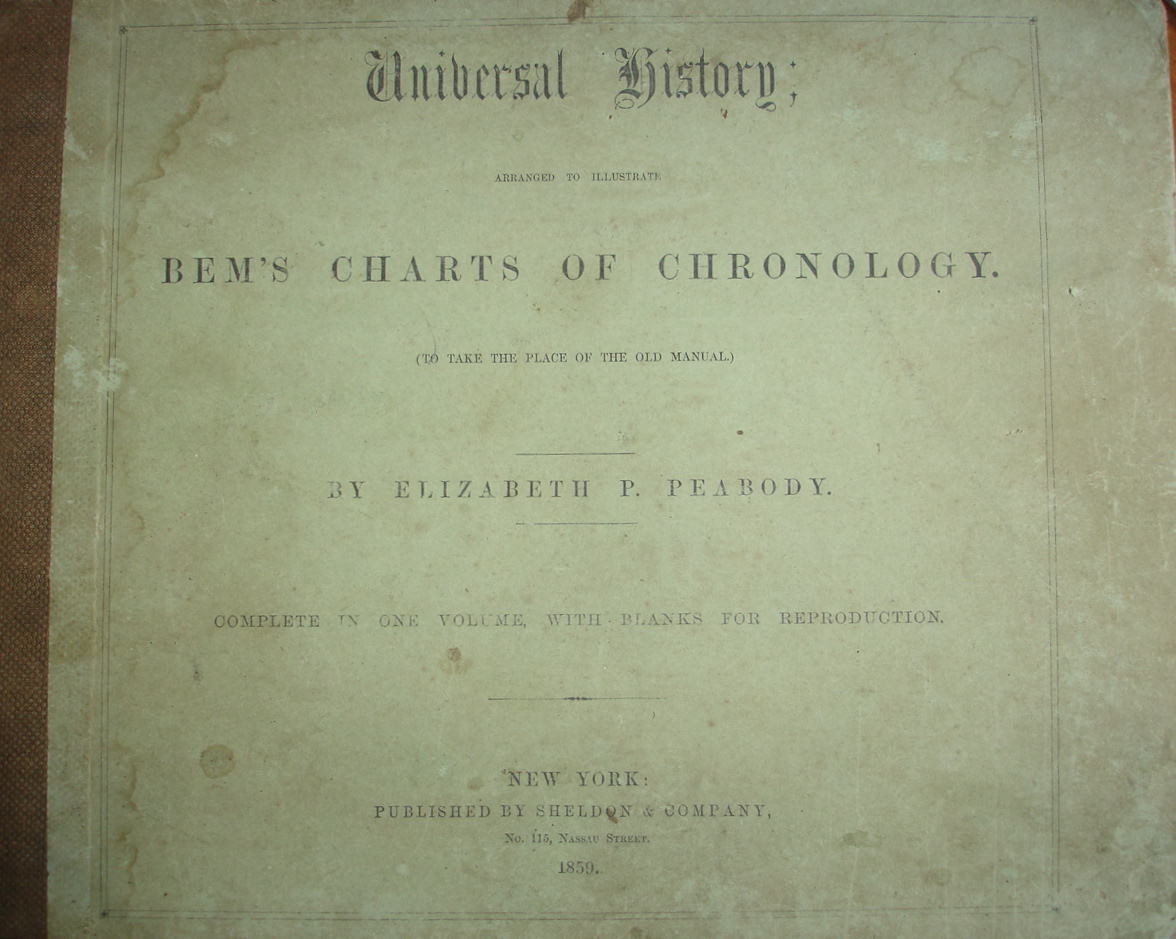
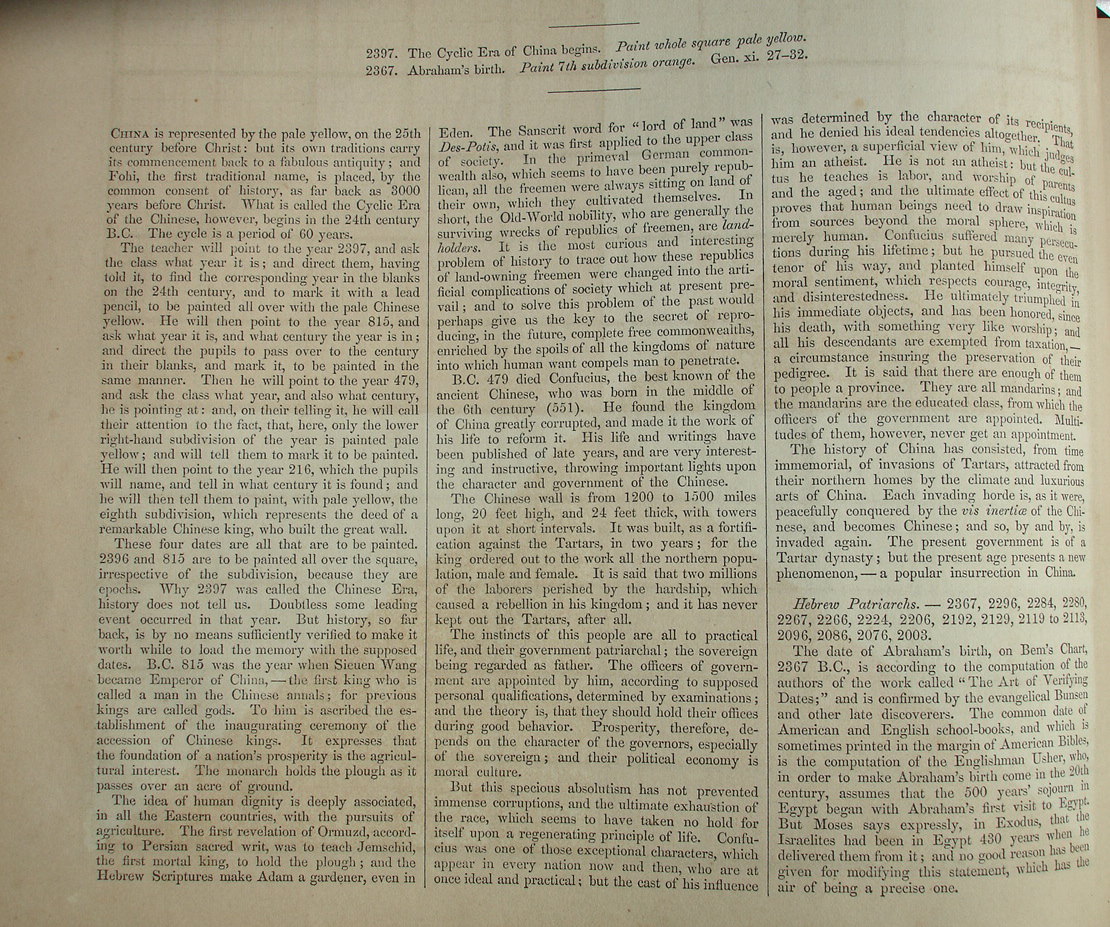
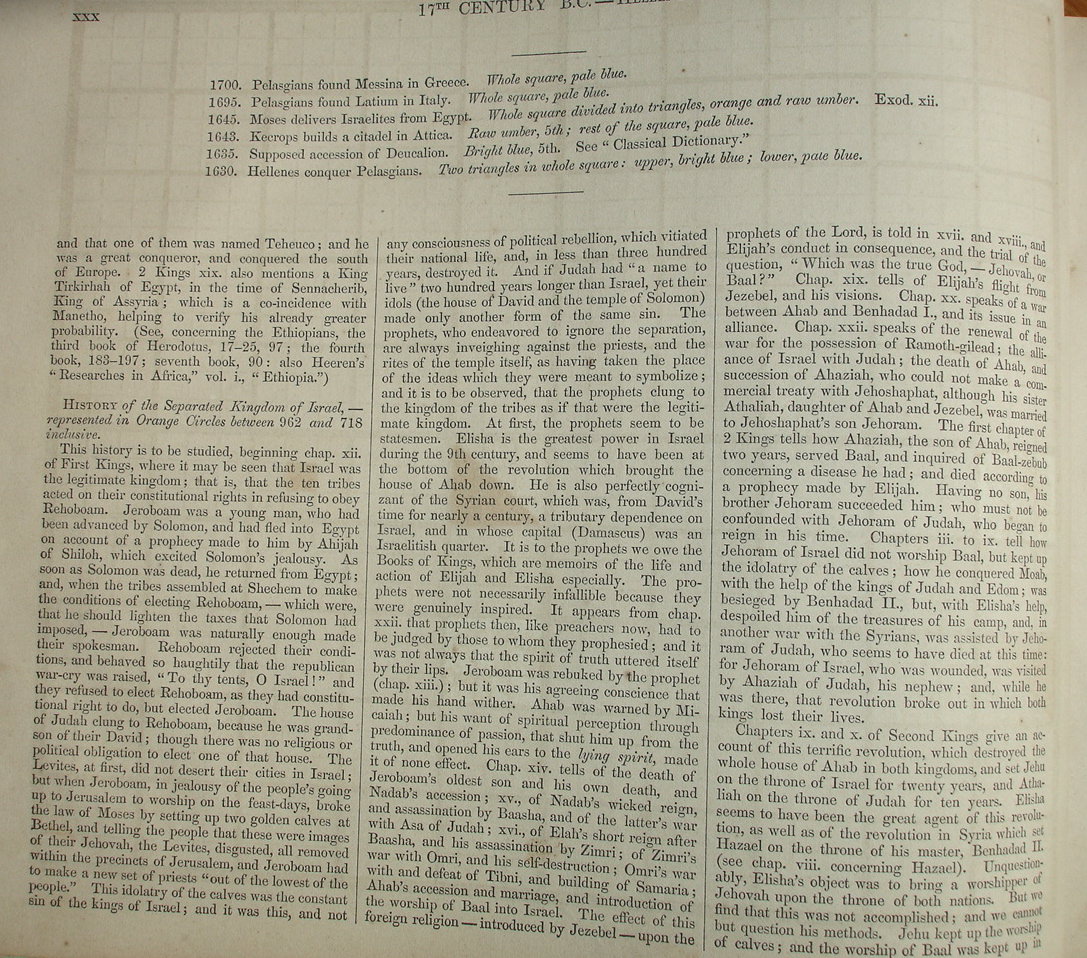
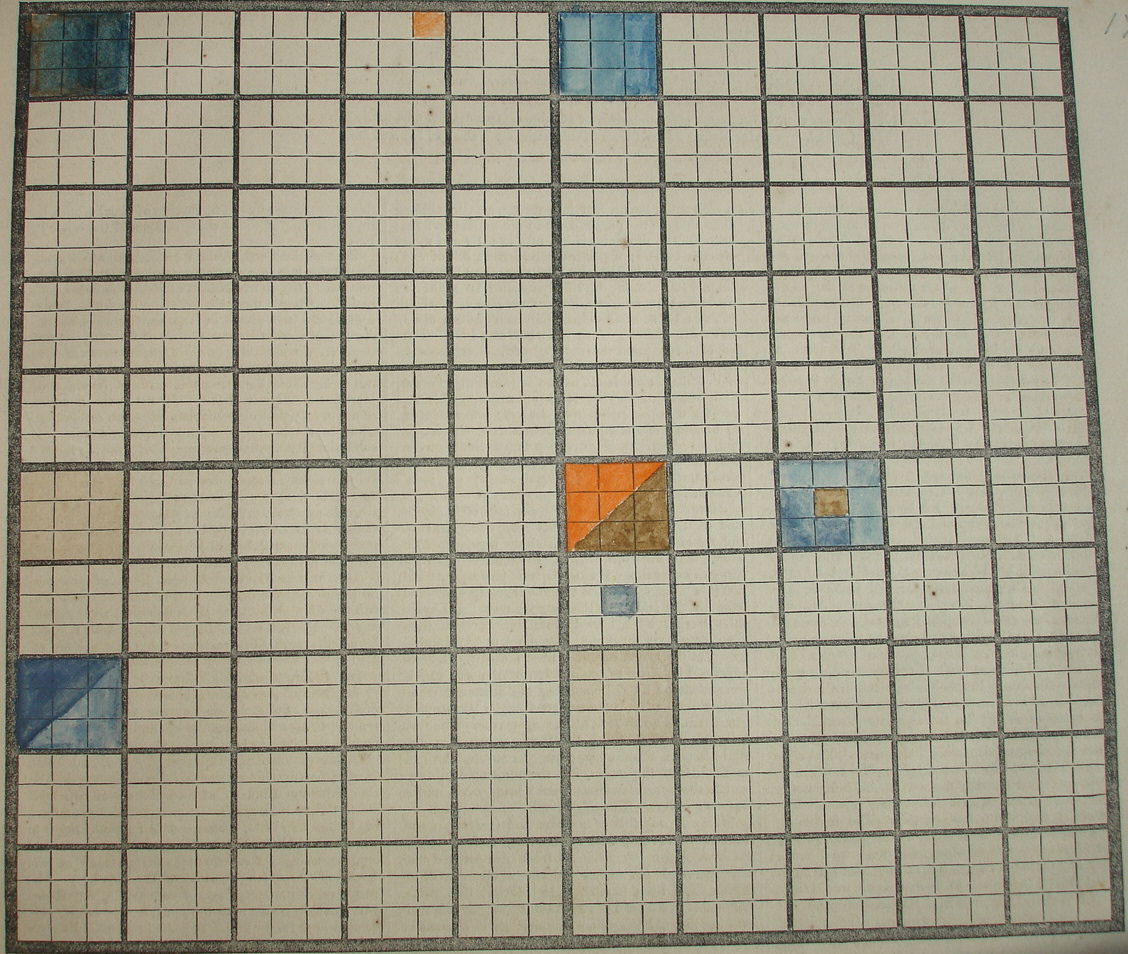
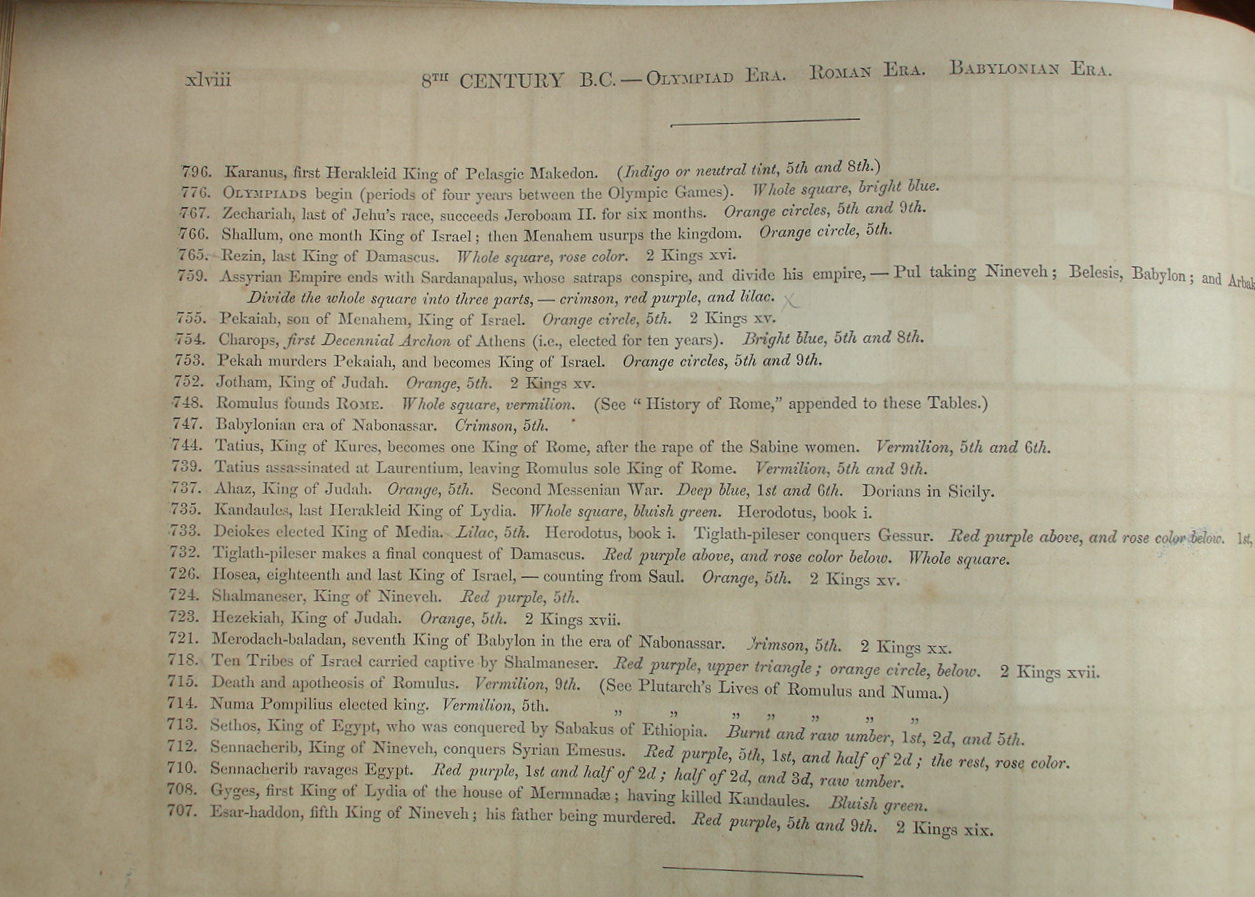
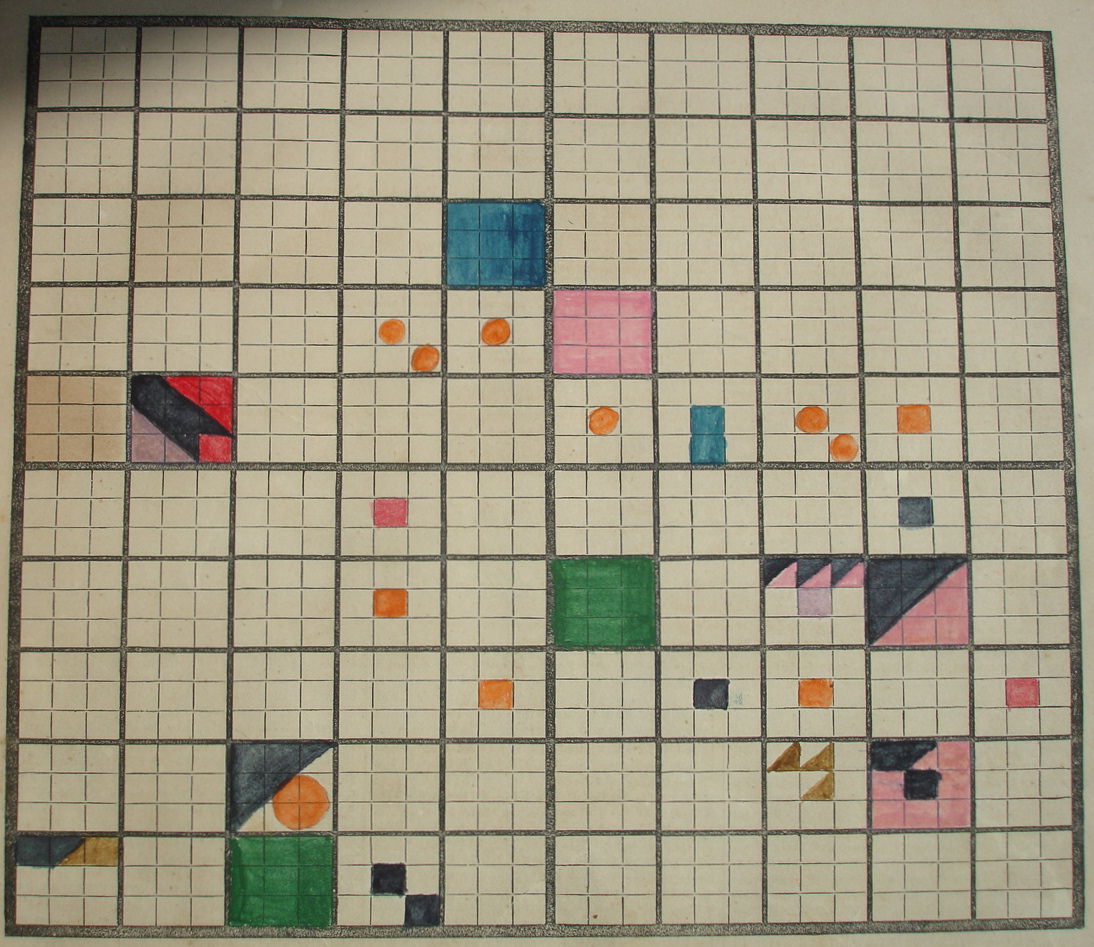
Pages from Elizabeth Peabody’s Universal History: Arranged to Illustrate Bem’s Charts of Chronology. New York: Pub. for the author by Sheldon and Co, 1859.
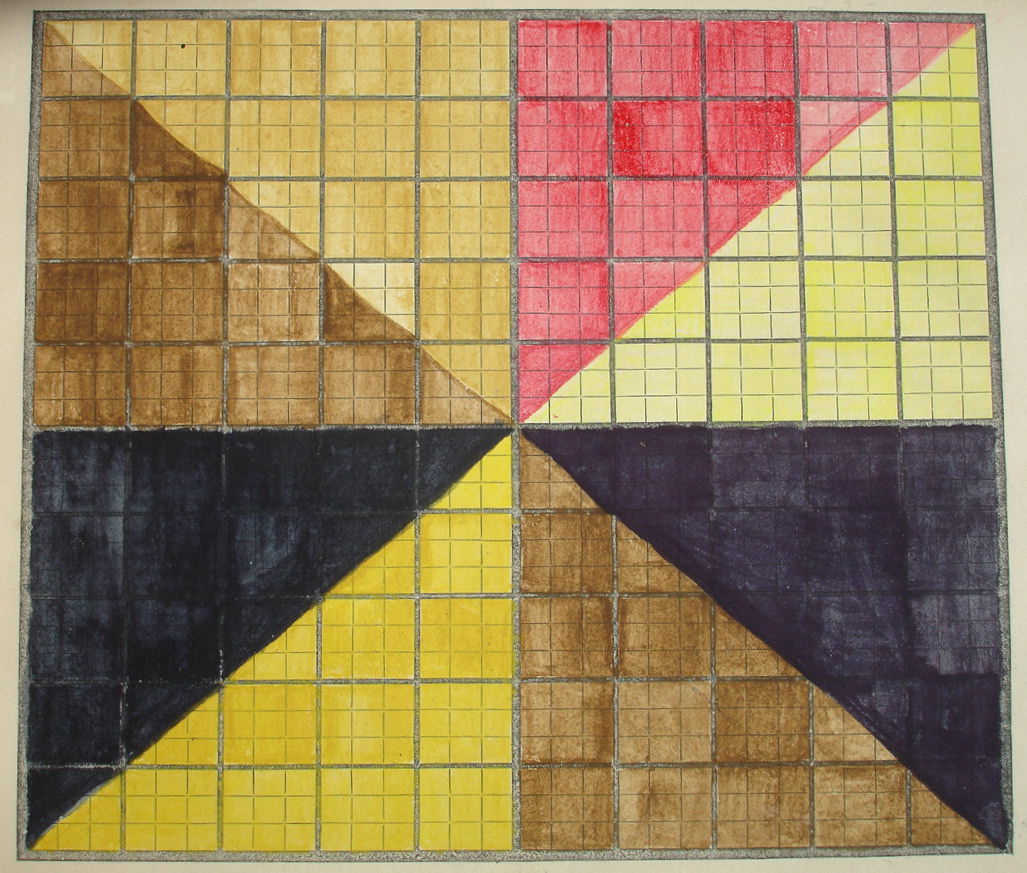
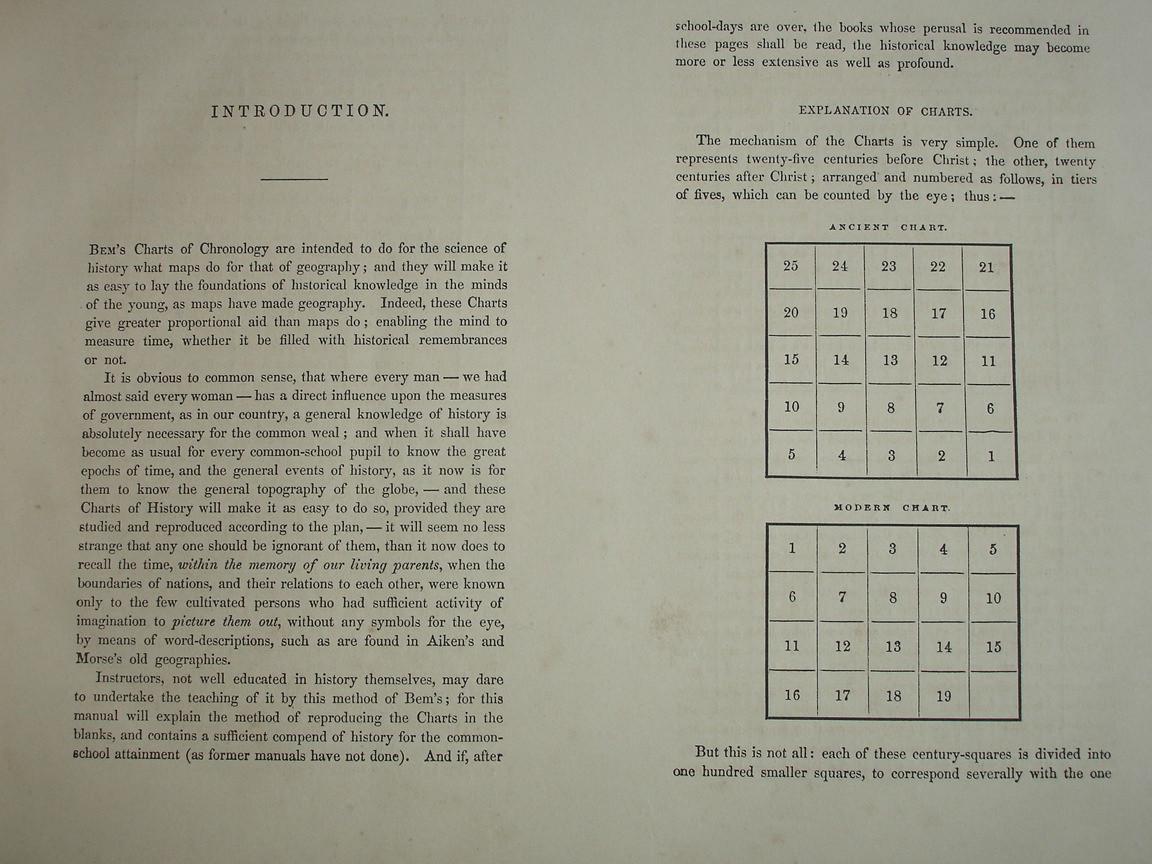
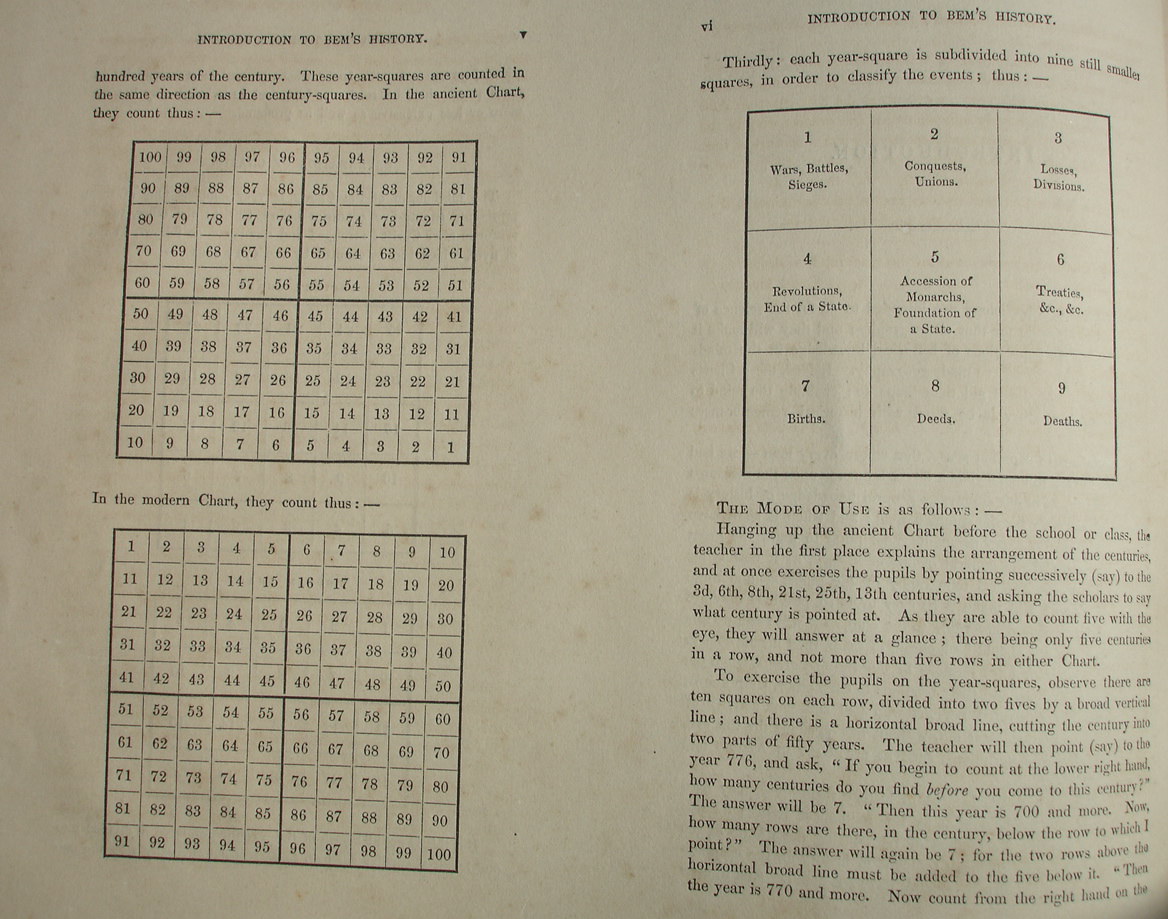
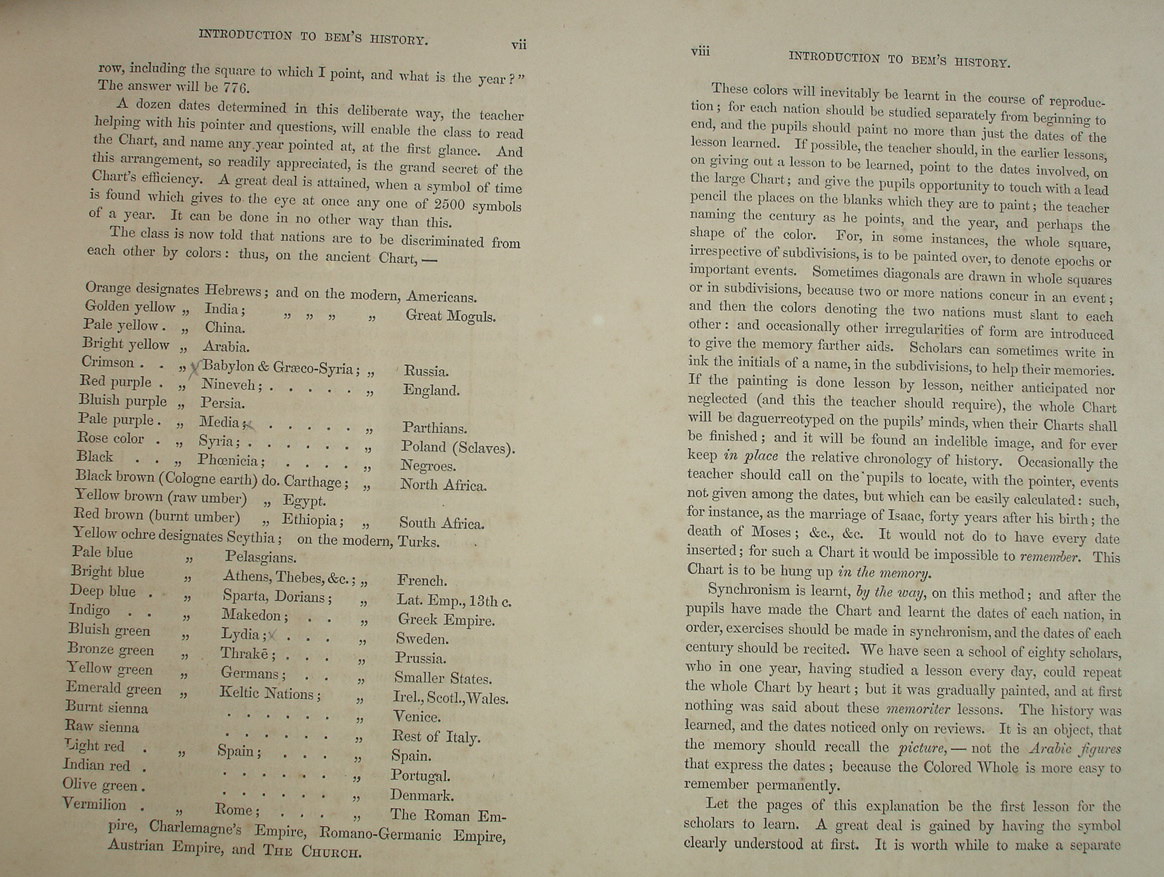
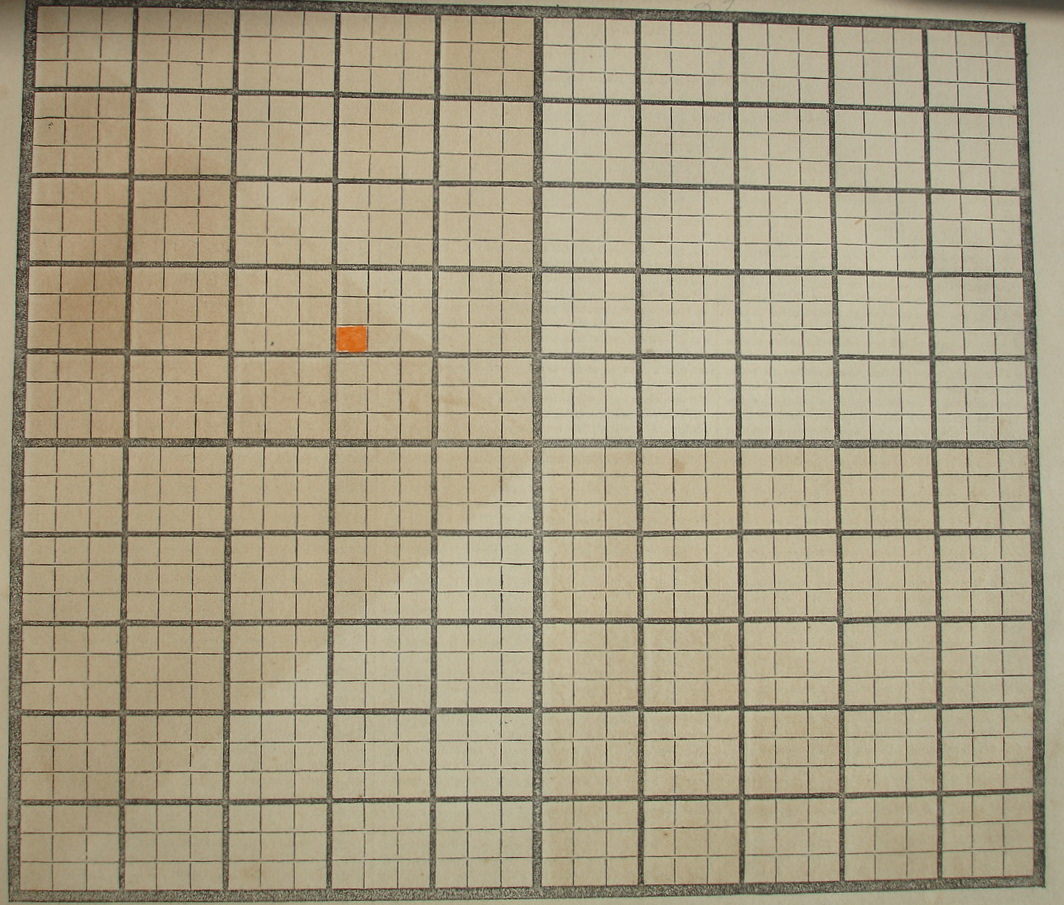
A system for charting historical events on a grid (representing historical periods, arranged chronologically); squares, divided into 9 parts each, to represent distinct categories of historical events; and colors, to show different “Nations”.
A curious abstract visual system for reducing history to shapes and color on a standard, single field of two-dimensional representation.
The end product, while perhaps not becoming a real mnenomic device for learning history (or a compelling Visual Display of Quantitative Information), produced some intriguing designs.
_________
______
_______

